

10 Things you can do in Chrome Developer Tools
List of things you can do while debugging CSS in dev tools


Here are 10 things you can do, if you want to edit CSS directly on the styles panel of the chrome dev tools while debugging.
1) Edit the Box Model directly
When you inspect an element, if you look into the computed section of the styles tab you will see the box model representation of the element. Did you know that you can edit the values in the box model directly?.
2) Color Palette & Contrast Ratio
When you see styles with color, you can click on the swatch which will open the color palette for you. Open the contrast ratio , green ticks means the color is in the acceptable contrast ratio, red means it does not meet the standard. The colors within the curved white spectrum are the ones which have a better color contrast ratio, if you choose colors outside of it you will notice that the contrast ratio check mark turns to red. Try adjusting the colors accordingly using the color picker to see what works best.
3) Changing color value syntax between hex, rgb and hsa
By default the color value seen in the styles tab is the one written in the css file, but this can be changed to show either hex or RGBA or HSA on the fly. This can be done by pressing Shift + clicking on the color value , it will change the values like seen in the below screen capture.
4) CSS shadows
Most times we use text shadows or box shadows during development. When in doubt or still trying to figure out the best values to use, you can use the developer tools to test out what works for you best.
5) Angle Clock
You would have used transform : rotate degree in css, by clicking on the icon next to the degree you can rotate the degree and see what works best for you.
6) Grid & Flex Layout
By clicking on the layout section, now you can find all the list of elements on the page which use display: flex or grid property. When you check the checkbox the element gets highlighted with dotted lines
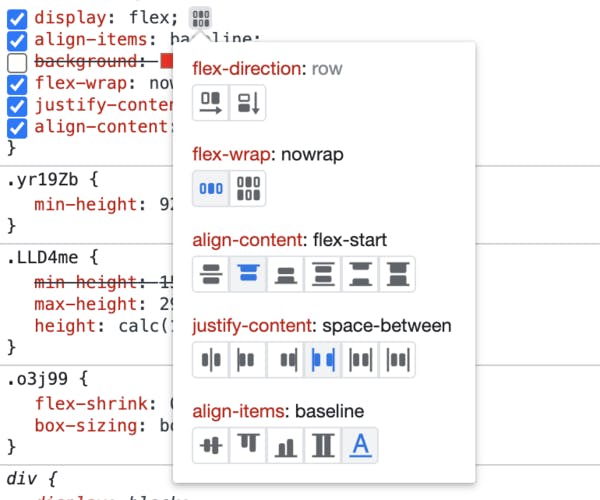
7) Flexbox debugging tool
Flexbox has variety of options, and if you would like to test them out , the new feature in dev tool has an icon next to the display:flex property using which you can try out all the options and see how the content/layout behaves.
8) Badge settings
In the elements tab you can see the list of elements which use flex, grid, scroll-snap or ads. Right click on the elements(eg: div, p , span etc) and select badge settings. You can choose the badges you think will be most required for your debugging. In the below screenshot, you can see that the moment i check scroll-snap , the badges showed up next to the div which had scroll snap enabled.
9) Visualize CSS scroll snap
CSS scroll snap lets you set the scroll offset position of a scroll container to be at a preferred snap position once the scroll operation is finished. Visualizing this can be difficult, and using the developer tool, you can see how/where your scroll position ends.
In the elements tab, you will find the list of elements which currently use scroll-snap. Click on it, and it will highlight the element to show you its position.
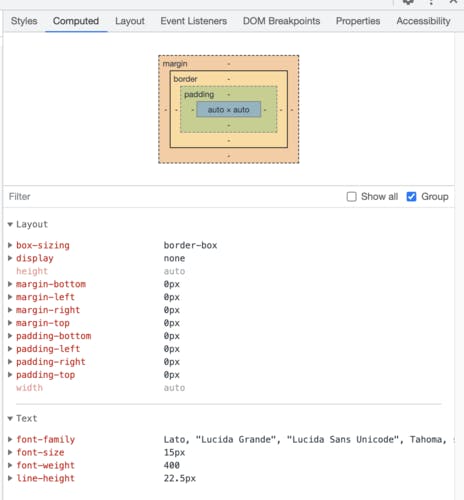
10) Grouping CSS properties in the Computed pane
On the computed section of the styles pane usually we see all the styles which are applied on a particular element. By clicking on group they are grouped together by category and you can focus just on the ones which are required for your debugging.
Let me know in the comments below your favorite among these and if there are others which you use.
Check out my other blog posts:
- Create a GitHub Profile README.md with widgets
- Getting Started with JavaScript - Ultimate Free Resources
Lets connect on Twitter | LinkedIn for more web development related chats.